Previous Highs & Lows (Customizable)Previous Highs & Lows (Customizable)
This Pine Script indicator displays horizontal lines and labels for high, low, and midpoint levels across multiple timeframes. The indicator plots levels from the following periods:
Today's session high, low, and midpoint
Yesterday's high, low, and midpoint
Current week's high, low, and midpoint
Last week's high, low, and midpoint
Last month's high, low, and midpoint
Last quarter's high, low, and midpoint
Last year's high, low, and midpoint
Features
Individual Controls: Each timeframe has separate toggles for showing/hiding high/low levels and midpoint levels.
Custom Colors: Independent color selection for lines and labels for each timeframe group.
Display Options:
Adjustable line width (1-5 pixels)
Variable label text size (tiny, small, normal, large, huge)
Configurable label offset positioning
Organization: Settings are grouped by timeframe in a logical sequence from most recent (today) to least recent (last year).
Display Logic: Lines span the current trading day only. Labels are positioned to the right of the price action. The indicator automatically removes previous drawings to prevent chart clutter.
ค้นหาในสคริปต์สำหรับ "high low"

Inverse Fair Value Gap [Pro+]Introduction
Inverse Fair Value Gap° is a fully customizable charting tool built to track inversion fair value gap logic that occur after displacement events—specifically when Fair Value Gaps (FVGs) are closed through, and effectively flipping their original state. The tool is inspired by Inner Circle Trader (ICT) concepts, offering a clean visual interface to support traders studying price behaviour after liquidity sweeps, FVG closures, and highlighting mechanical swings targets.
This indicator does not draw zones or suggest direction. It operates entirely on confirmed price events and produces logic-bound visuals designed for traders who already understand IFVG-based reasoning and seek visual consistency across sessions, Timeframe on any instrument.
Key Terms and Definitions
Swing High / Swing Low: A swing high is a local price peak with lower highs on either side. A swing low is a local trough with higher lows on either side. These are used to detect where liquidity may rest and are required for confirming the initial raid condition in the IFVG model.
Liquidity Raid: This occurs when price trades through a prior swing high or low, effectively “sweeping” a level where orders may be clustered around. The raid is a required precursor to inversion logic in this model. The tool will not evaluate a potential Fair Value Gap or Inversion Fair Value Gap unless a swing high or low has been taken first.
Fair Value Gap (FVG): A Fair Value Gap is a price imbalance that occurs when a strong move leaves a gap between candles—specifically, when the high of one candle and the low of a later candle do not overlap. FVGs often emerge during displacement and are commonly studied as inefficiencies within a price leg.
Inversion Fair Value Gap: An inversion happens when price fully closes through an existing Fair Value Gap that raided liquidity, suggesting the original imbalance rebalanced, and looks to reverse its original role. For example, when a bearish FVG is closed above after raiding a swing low, it may present a shift in orderflow (bullish inversion). The tool recognizes IFVGs as “inverted” after a candle body candle closes through the gap post raid.
Displacement: A strong directional price move, typically with momentum, that leaves a Fair Value Gap behind. Displacement is important in inversion logic, as it creates the context and confidence in comparing and contrasting FVGs and Inversions for obvious flips in market behaviour.
IFVG Line: Once inversion occurs, the indicator draws a single horizontal array on the candle's close. It marks the start of model activation. This is not a prediction level or a support/resistance area, as it merely serves as a reference for when model logic is sequentially active.
Opposing Swing: The swing high or low opposite the one that was swept during the initial raid. This becomes the model’s first target for mechanical delivery and is automatically drawn once the IFVG line is plotted. When price reaches this swing, the model has reached its mechanical objective and could offer opportunities for further continuation to additional liquidity pools if orderflow continues to be present.
Invalidation: The Inversion Fair Value Gap is considered invalid in one of two scenarios, which the user can toggle individually: a body print back above/below the inversion in bearish/bullish conditions, or trading above/below the most recent swing high/low after the liquidity raid. The IFVG line will continue extending until the setup is invalidated by the chosen toggle, or when the Opposing Swing is reached.
Consequent Encroachment (CE): The midpoint (50%) of the FVG or IFVG. This line can be optionally displayed for users who use the midpoint of imbalances for reference of imbalance respect. It is not required by the model’s internal logic but may assist with discretionary interpretation.
Description
At its core, IFVG° follows a structured three-step logic sequence: a FVG is created, liquidity is taken, and the Fair Value Gap (FVG) inside of the leg of the raid is closed through, signally a potential orderflow shift. Once inversion is confirmed, an IFVG line is plotted at the close of the candle that caused the inversion, making it the structural anchor for the model.
The tool does not account for partial fills or candle wicks for FVGs or IFVGs. Only full-body closures through a qualifying FVG are recognized. When this occurs, a bullish or bearish inversion is plotted and the model becomes active. From there, the opposing swing (the unswept high or low from the displacement leg) is automatically drawn as the target for the model.
The model remains active until either the opposing swing is tagged (completion) or Invalidation Condition is triggered (close through IFVG, or price violating the liquidity raid swing). Upon invalidation, the IFVG line turns gray, signaling that the structure is no longer valid for ongoing tracking.
Key Features
The Bias allows traders to define whether to track bullish inversions (closing above bearish FVGs), bearish inversions (closing below bullish FVGs), or neutral to see both. This allows isolated directional focus as well as the ability to display all models.
The Liquidity Timeframe defines the Timeframe for swing highs and lows that are identified for the required liquidity raid. The Chart mode allows analysts to use the active chart Timeframe. Auto enables a pre-defined Timeframe Alignment, explained inside of the setting tooltip. Custom allows for user-defined Timeframe alignment, which is helpful when syncing with specific higher-Timeframe structures. Session allows the user to use session highs and lows for the liquidity raid. Observe the difference in the IFVG' model activations based on different Liquidity Timeframe configurations:
Chart:
Automatic:
Custom (4H):
Session:
The FVG Filter Timeframe requires the IFVG setup to trade into a FVG before qualifying the raid filter. For instance, setting this to 4H ensures that only setups that form within a 4-hour FVG. This gives analysts an additional filter to qualify the start of the mechanical model.
The Session Filter enables traders to define up to four specific Time blocks when the model is permitted to trigger. The Macros Only toggle filters setups further by limiting activation to the first and last 10 minutes of each hour, a filter inspired for intraday traders and scalpers.
The Invalidation Condition determines when a IFVG is considered no longer valid. The Close option will maintain the inversion as active until price prints a body past the IFVG. Swing will maintain the inversion as active until the most recent swing from the liquidity raid is traded through; in this case a warning icon will appear once price prints a candle body past the IFVG.
Model Style includes customizable controls for the IFVG line, the opposing swing marker, and invalidated states. Label appearance, line styles, and extension behaviour are fully user-controlled. Traders can also enable the Consequent Encroachment (CE) line, which marks the 50% midpoint of the FVG.
An Info Table is available to display the charts Timeframe, current model state, toggled bias, active Timeframes, asset, and Time filter. Its position is fully customizable and can be moved to match chart preferences.
How Traders Can Use the Indicator Effectively
IFVG° is not meant to identify trade signals, entries, or exits. It is best used as a visual tracker and confluence for structure-based delivery. The tool excels as a companion for:
Journaling and reviewing IFVG-based setups across Timeframes and sessions
Studying structural completion or invalidation behaviour
Tracking delayed deliveries and retracement-based logic
Traders using the tool should be familiar with FVG formations, inversion criterias, and the importance of orderflow once an opposing swing is reached.
Usage Guidance
Add the IFVG° to a TradingView chart. This is a fractal script and can be applied across any Timeframe or asset pairing.
Use the IFVG line to track inversion structure, monitor when inversions are created and negated, and reference the opposing swing to determine whether structural delivery has completed.
Use the IFVG in combination with your own discretion and narrative to assess when the model has flipped, held, or broken.
Terms and Conditions
Our charting tools are products provided for informational and educational purposes only and do not constitute financial, investment, or trading advice. Our charting tools are not designed to predict market movements or provide specific recommendations. Users should be aware that past performance is not indicative of future results and should not be relied upon for making financial decisions. By using our charting tools, the purchaser agrees that the seller and the creator are not responsible for any decisions made based on the information provided by these charting tools. The purchaser assumes full responsibility and liability for any actions taken and the consequences thereof, including any loss of money or investments that may occur as a result of using these products. Hence, by purchasing these charting tools, the customer accepts and acknowledges that the seller and the creator are not liable nor responsible for any unwanted outcome that arises from the development, the sale, or the use of these products. Finally, the purchaser indemnifies the seller from any and all liability. If the purchaser was invited through the Friends and Family Program, they acknowledge that the provided discount code only applies to the first initial purchase of any Toodegrees product. The purchaser is therefore responsible for cancelling – or requesting to cancel – their subscription in the event that they do not wish to continue using the product at full retail price. If the purchaser no longer wishes to use the products, they must unsubscribe from the membership service, if applicable. We hold no reimbursement, refund, or chargeback policy. Once these Terms and Conditions are accepted by the Customer, before purchase, no reimbursements, refunds or chargebacks will be provided under any circumstances.
By continuing to use these charting tools, the user acknowledges and agrees to the Terms and Conditions outlined in this legal disclaimer.
สคริปต์แบบชำระเงิน

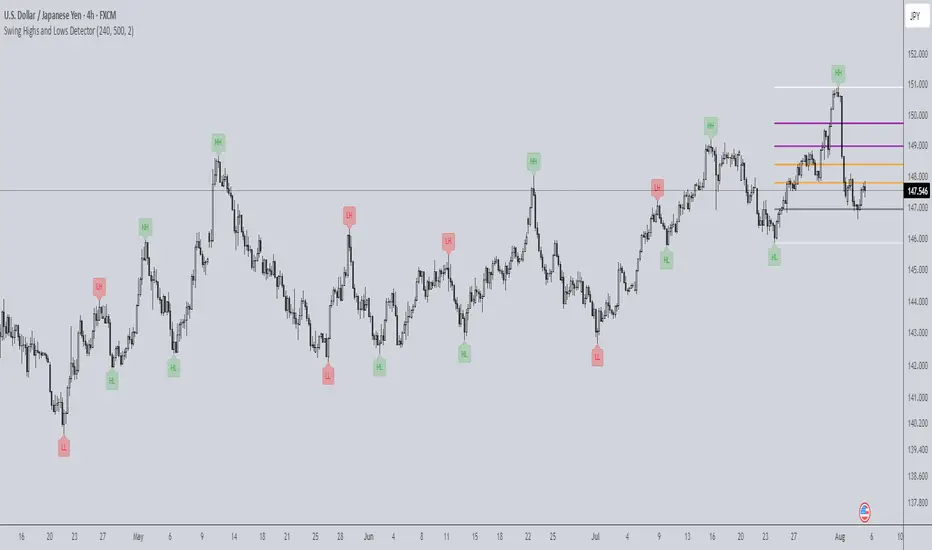
Swing Highs and Lows Detector🔍 Swing Highs and Lows Detector
The Swing Highs and Lows Detector is a powerful tool for traders looking to identify meaningful structural shifts in price action, based on swing point logic and internal trend shifts.
📈 What It Does
This indicator automatically identifies and labels:
HH (Higher High) – Price broke above the previous swing high
LH (Lower High) – Price failed to break the previous high, signaling potential weakness
LL (Lower Low) – Price broke below the previous swing low
HL (Higher Low) – Price maintained a higher support level, indicating strength
The script distinguishes between bullish and bearish internal shifts and tracks the highest/lowest points between those shifts to determine the swing structure.
⚙️ How It Works
You can choose between two shift detection modes:
"Open": Compares closing price to the first open of the opposite streak
"High/Low": Uses the high of bearish or low of bullish candles
Once a shift is confirmed, the indicator scans the bars between shifts to find the most significant swing high or low
When a valid swing is detected, it’s labeled directly on the chart with color-coded markers
🛎️ Built-in Alerts
Set alerts for:
Higher High
Lower High
Lower Low
Higher Low
These alerts help you catch key structural shifts in real time — great for breakout traders, structure-based analysts, and smart money concepts (SMC) strategies.
✅ How to Use
Confirm Trend Strength or Reversals – Use HH/HL to confirm an uptrend, LL/LH to confirm a downtrend
Combine with Liquidity Sweeps or Zones – Ideal for SMC or Wyckoff-style setups
Entry/Exit Triggers – Use swing breaks to time entries or exits near key structural points
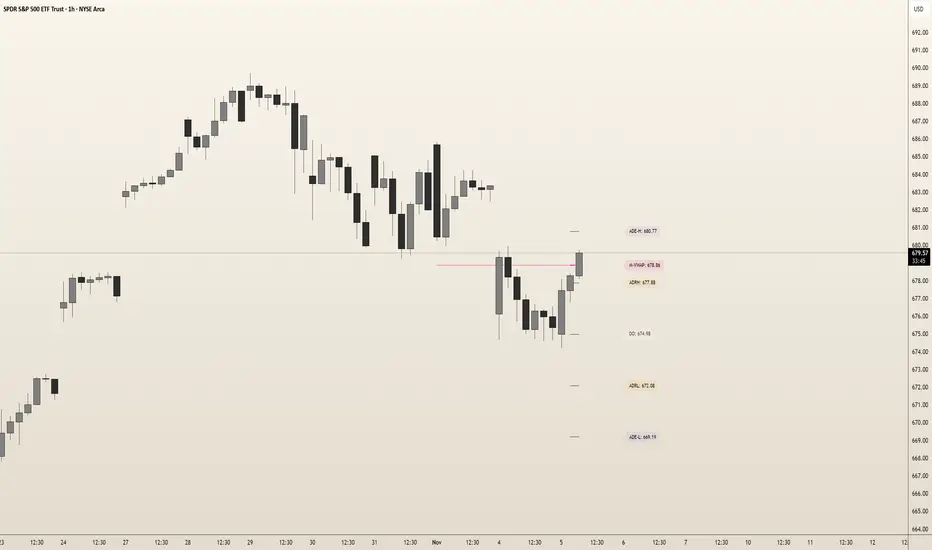
Teddy LiteOverview
"Teddy" overlays key price levels—Daily Open (DO), Average Daily Range (ADR), and ADR Extensions (ADE)—on intraday charts. Designed for traders, it provides a clear framework to align with market ranges, avoid choppy price action, and stay out of overbought/oversold conditions, enhancing decision-making in dynamic markets.
Originality and Usefulness
"Teddy" uniquely combines DO, ADR High/Low, and ADE High/Low with dynamic percentage labels, while offering a concise view of price boundaries for daily Highs and Lows.
What It Does
Plots DO, ADR High/Low, and ADE High/Low as levels on the chart.
Labels each level with percentage distances from the current price (e.g., "ADRH (2.34%)").
Customizes visuals for clarity (colors, line styles, label sizes).
How It Works
Data Sources: Retrieves daily open and historical high/low data to compute ranges.
Calculations:
Daily Open (DO): Marks the session’s opening price.
ADR: Estimates typical daily range from past data, centered on DO to set High/Low bounds.
ADE: Extends ADR by a fixed percentage for outer limits.
Visualization: Updates lines and labels live, with user-defined colors, styles, and sizes.
How It Helps Traders
"Teddy" guides traders to avoid chasing markets in extended conditions:
Respecting the range: ADR High/Low define range-friendly zones—price above DO nearing ADR High signals bullish momentum is peaking, while below DO near ADR Low supports bearish momentum peaking.
Avoiding Choppy Conditions: Price lingering near DO often indicates indecision; "Teddy" highlights this level, helping you define balanced market conditions that favor choppy conditions.
Steering Clear of Overbought/Oversold: ADE High/Low mark extended levels where reversals are extremely—price hitting ADE Highlights the trend strength on the day but warns price is extremely over extended.
This structured approach keeps trades aligned with the markets average range, so traders can avoid extremes favorable levels for choppiness.
How to Use It
Apply to an intraday chart (e.g., SPY 5m).
Customize via inputs:
"Appearance Settings": Colors, line styles (Solid, Dotted, Dashed), widths (1-6), label visibility, and sizes (Tiny to Huge).
Watch levels: Consider reducing risk as the market approaches our ADRH/L levels. Trades can also play breakouts/failed breakouts at ADR High/Low or at ADE High/Low. Additionally remaining patient while the auction remains in balance near Day Open is an option as well.
Underlying Concepts
Range Dynamics: ADR reflects average daily volatility, DO anchors context, and ADE flags extensions.
Price Action: Levels highlight Volatility/Range (ADR) versus consolidation (DO) or expansive exhaustion (ADE).
Limitations
Optimized for day traders during live sessions; less effective in low-volatility periods.
Requires sufficient historical data for accurate ADR/ADE.
Levels are contextual and where I expect reactive price action to occur.. They are not guaranteed signals.
Inner Circle Toolkit [TakingProphets]Inner Circle Toolkit — A Complete ICT Trading Companion
The Inner Circle Toolkit is a closed-source, all-in-one trading tool designed for traders following ICT (Inner Circle Trader) and Smart Money Concepts strategies. Every part of this script is built with purpose — not just a mashup of indicators, but a structured framework to help you follow price through the lens of institutional behavior and liquidity theory.
Let’s walk through what it does and how it can help you:
🕒 Session Liquidity Levels (Asia, London, New York, NY Lunch)
The indicator automatically marks the highs and lows of the major trading sessions:
-Asian Session
-London Session
-New York AM Session
-New York Lunch
These levels are important because price often returns to these points to grab liquidity before making a move. This gives traders clear areas to watch for potential sweeps, rejections, or reversals — without having to manually track session timings every day.
REQHs and REQLs — Equal Highs and Lows
This script detects Relatively Equal Highs and Lows (REQHs/REQLs), which are often used by institutions as stop-run targets.
It’s not just looking for copy-paste double tops or bottoms — it uses a tolerance-based algorithm that checks for clusters of similar highs or lows over a given time period. These are likely to hold stops and become magnets for price. When you see these on the chart, you’ll know where the “juice” is sitting.
Fair Value Gaps (FVG) — Multi-Timeframe
The script automatically plots Fair Value Gaps (FVGs) on both:
-Your current chart timeframe
-One or more higher timeframes (like H1 or H4)
These are three-candle gaps that form when price moves aggressively without filling in value. Price often comes back to these areas to rebalance. Seeing both local and higher-timeframe FVGs on your chart gives better context and helps with entries and exits.
The script is optimized so your chart doesn’t get messy — higher timeframe FVGs show up in a cleaner format with visual labels and lighter shading.
SMT Divergence — With Session Logic
This tool includes a real-time SMT divergence detector, based on the behavior of correlated markets like ES vs. NQ.
Here’s how it works:
If ES sweeps a liquidity level (like Asia Low), but NQ doesn’t, the script detects and marks that divergence.
This often signals institutional accumulation or distribution — a high-probability setup.
You won’t have to flip between charts or manually compare — the SMT logic runs automatically and only fires when it matters (at key session levels). It’s a smarter, more focused way to track intermarket divergences.
Daily Highs and Lows — Week-to-Week Structure
The indicator keeps track of the high and low for each day of the week — Monday through Friday — helping you understand how price is evolving across the week.
This helps build a weekly profile:
Did Monday set the high of the week?
Are we sweeping Tuesday’s low on Thursday?
These levels stay visible and labeled, helping you frame daily setups inside the bigger picture.
🕛 Midnight Open & 8:30 AM Open Levels
These two levels are core ICT concepts used to judge whether price is in premium or discount:
Midnight Open (00:00 EST): Used to determine daily bias
New York Open (08:30 EST): Often a launch point for key moves
Both are drawn automatically and extend throughout the day. This helps you align your trades with potential algorithmic bias, especially during NY session volatility.
⏰ 9:45 AM Vertical Marker — Macro Time Reminder
The script draws a subtle vertical line at 9:45 AM EST, which is the start of the NY AM macro session — one of the most likely times to see setups play out.
This is more than just a timer — it’s a visual cue that something important might be setting up soon, especially if you’re already watching SMT, FVGs, or liquidity zones from earlier.
How It All Connects — A Workflow, Not a Mashup
Every feature in this script is connected to the same goal: helping you trade with the Smart Money.
Here’s how the pieces work together:
Session levels → potential stop hunts
Equal highs/lows → targets
FVGs → entry points
SMT divergence → confirmation or warning
Daily highs/lows → Weekly structure frames bias
Open levels → premium vs. discount
Macro line → timing clue for execution
It’s built to help you flow with price action and trade the story, not just random signals.
Why It’s Closed Source — and Original
This script is closed-source because it contains:
A proprietary system for real-time SMT logic (with intermarket sweep detection)
Multi-timeframe FVG detection that auto-filters overlaps
Smart equal-high/low detection using range-based clustering
Optimized UI that shows a lot without overwhelming the chart
There are no moving averages, no public-domain indicators, and no mashup of standard tools. Everything here is purpose-built for traders who follow ICT strategies.
Let us know how we can improve!

IU Bigger than range strategyDESCRIPTION
IU Bigger Than Range Strategy is designed to capture breakout opportunities by identifying candles that are significantly larger than the previous range. It dynamically calculates the high and low of the last N candles and enters trades when the current candle's range exceeds the previous range. The strategy includes multiple stop-loss methods (Previous High/Low, ATR, Swing High/Low) and automatically manages take-profit and stop-loss levels based on user-defined risk-to-reward ratios. This versatile strategy is optimized for higher timeframes and assets like BTC but can be fine-tuned for different instruments and intervals.
USER INPUTS:
Look back Length: Number of candles to calculate the high-low range. Default is 22.
Risk to Reward: Sets the target reward relative to the stop-loss distance. Default is 3.
Stop Loss Method: Choose between:(Default is "Previous High/Low")
- Previous High/Low
- ATR (Average True Range)
- Swing High/Low
ATR Length: Defines the length for ATR calculation (only applicable when ATR is selected as the stop-loss method) (Default is 14).
ATR Factor: Multiplier applied to the ATR to determine stop-loss distance(Default is 2).
Swing High/Low Length: Specifies the length for identifying swing points (only applicable when Swing High/Low is selected as the stop-loss method).(Default is 2)
LONG CONDITION:
The current candle’s range (absolute difference between open and close) is greater than the previous range.
The closing price is higher than the opening price (bullish candle).
SHORT CONDITIONS:
The current candle’s range exceeds the previous range.
The closing price is lower than the opening price (bearish candle).
LONG EXIT:
Stop-loss:
- Previous Low
- ATR-based trailing stop
- Recent Swing Low
Take-profit:
- Defined by the Risk-to-Reward ratio (default 3x the stop-loss distance).
SHORT EXIT:
Stop-loss:
- Previous High
- ATR-based trailing stop
- Recent Swing High
Take-profit:
- Defined by the Risk-to-Reward ratio (default 3x the stop-loss distance).
ALERTS:
Long Entry Triggered
Short Entry Triggered
WHY IT IS UNIQUE:
This strategy dynamically adapts to different market conditions by identifying candles that exceed the previous range, ensuring that it only enters trades during strong breakout scenarios.
Multiple stop-loss methods provide flexibility for different trading styles and risk profiles.
The visual representation of stop-loss and take-profit levels with color-coded plots improves trade monitoring and decision-making.
HOW USERS CAN BENEFIT FROM IT:
Ideal for breakout traders looking to capitalize on momentum-driven price moves.
Provides flexibility to customize stop-loss methods and fine-tune risk management parameters.
Helps minimize drawdowns with a strong risk-to-reward framework while maximizing profit potential.

Advanced Market Structure & Order Blocks (fadi)Advanced Market Structure & Order Blocks indicator provides a new approach to understanding price action using ICT (Inner Circle Trader) concepts related to candle blocks to analyze the market behavior and eliminate much of the noise created by the price action.
This indicator is not intended to provide trade signals, it is designed to provide the traders with to support their trading strategies and add clarity where possible.
There are currently three main elements to this indicator:
Market Structure
Order Blocks
Liquidity Voids
Market Structure
In trading, market structure is often identified by observing higher highs and higher lows. An uptrend is characterized by a series of higher highs, where each peak surpasses the previous one, and higher lows, where each trough is higher than the preceding one. Conversely, a downtrend is marked by lower highs and lower lows.
Other indicators usually determine these peaks by calculating the highest or lowest levels within a predefined number of candles. For example, identifying the highest price level within the last 15 candles and marking it as a higher high or a lower high. While this approach offers some structure to price action, it can be arbitrary and random due to price fluctuations and the lack of proper structure analysis beyond finding the highest peaks and valleys within candle ranges.
In his 2022 mentorship, episode 12, ICT introduced an alternative approach focusing on three-candle pivots called Short Term High and Low (STH/STL), which are then used to calculate the Intermediate Term High and Low (ITH/ITL), and in turn, the Long Term High and Low (LTH/LTL). ICT’s approach provides better structure than the traditional method mentioned above. However, it can be confusing and difficult to track. There are great indicators that track and label ICT’s levels, but traders still find it challenging to follow and understand.
The Advanced Market Structure indicator takes a unique approach by analyzing candle formations, using ICT concepts, to identify possible turning points that mimic a real trader’s analysis of price action as closely as possible. However, it should be expected that Market Makers may use market manipulation to induce traders to make failed trades, and no tooling can eliminate these situations.
Advanced Market Structure tracks true Peaks and Valleys as they form, confirms them, and marks the chart with corresponding labels using traditional labeling methods (HH/HL/LH/LL), as such labeling makes it easier for traders to follow and understand. The indicator also draws levels to help identify possible liquidity areas and trade targets.
The indicator uses different calculation methods for the different type of market structure length, however all calculations are based on the same ICT candle blocks concepts.
Market Structure Settings
Other than the display settings, there are four (4) settings, mainly under the Level Settings section.
Allow Nested Candles
This option is only available on the Short Market Structure due to the methods used in calculating highs and lows. When used, the indicator will attempt to detect smaller fluctuations in price by tracking smaller candle moves, if any.
Level Settings
Level Settings allows the trader to decide two main calculations:
1. A new pivot point will form when a candle’s is crossed by the following candle’s
2. For a liquidity sweep and marking a level as mitigated, a candle’s must cross that level
Order Blocks
ICT (Inner Circle Trader) defines an Order Block as the last down-closing candle, or series of candles, before a significant upward price move or the last up-closing candle, or series of candles, before a significant downward price move. These key price levels, marked by substantial buy or sell orders from institutional traders or "smart money," create a block or zone on the price chart. When the price revisits these levels, it often leads to a strong market reaction. Order Blocks can consist of one or multiple consecutive candles of the same color, signaling areas of significant buying or selling interest. ICT's approach to Order Blocks provides traders with a structured method to identify potential areas of support or resistance, where price movements are more likely to change direction. Although ICT has shared some criteria for identifying Order Blocks publicly, the full details are reserved for his upcoming books. This indicator leverages the publicly available information to provide traders with valuable insights into these crucial price levels.
The Advanced Market Structure indicator is designed to be highly flexible, allowing traders to define their own combination of rules for identifying Order Blocks, thus customizing it to fit their unique trading strategies.
Order Block Configuration
Can be nested
An Order Block is defined as the last down candle or candles before a strong move higher, and vice versa for bearish Order Blocks. However, larger-than-usual candles resulting from news events or price action may not qualify as Order Blocks and can mute any Order Block within their range.
The "Can be nested" flag ensures that each Order Block is treated as an independent entity, even if it appears within the body of another Order Block.
Forms at swing point
Order Blocks formed at swing points typically have higher probabilities but are less frequent, assuming the same rules are applied. Additionally, Order Blocks at swing points may become Breaker and Mitigation blocks if they fail, providing more trading opportunities.
Forms a simple pivot point
A simple pivot point corresponds to ICT Short Term High and Low (STH/STL). Order Blocks using simple pivot points can occur in the middle of a move, not just at swing points. These are useful for identifying IOFED setups and supporting blocks that can bolster the price move.
Causes Market Structure Shift
Order Blocks that result in a break above or below a short swing point can help narrow down target order blocks, but they are less frequent. An Order Block causing a break above or below a pivot point does not necessarily indicate a strong Order Block. For example, an Order Block formed at a Lower Low is more likely to fail in a downtrend.
A clean close above order block
When the first candle breaks above an Order Block and closes above its high, this indicates a stronger Order Block. On the other hand, if a candle merely wicks through the Order Block without a solid close above it, it suggests a weaker Order Block. This may indicate hesitation or an impending reversal, as the wick represents a temporary and unsustained price movement.
Has displacement more than X the body
While some traders may capitalize on the initial break above an Order Block's CISD level, others prefer to focus on the return to an Order Block after displacement. Displacement is determined by the body size of the Order Block, and an Order Block cannot be tested until this level has been achieved.
Has a Fair Value Gap
When an Order Block is combined with a Fair Value Gap (FVG), it signifies a strong Order Block. The Fair Value Gap indicates a strong price movement away from the Order Block.
Has a liquidity void
A Liquidity Void occurs when two consecutive candles of the same color do not overlap, creating a gap similar to a Fair Value Gap, but involving one or more middle candles. Liquidity Voids can be utilized in combination with, or as an alternative to, the displacement setting.
Maximum number of OBs
The maximum number of Order Blocks to display.
Mitigated at block’s
An Order Block is considered mitigated when price reaches one of the main Order Block levels.
Liquidity Void
Liquidity Void refers to areas on a price chart where there is one-sided trading activity. This phenomenon occurs when the price of an asset moves sharply in one direction, leaving gaps where two consecutive candles of the same color do not overlap. These gaps can comprise one or more middle candles and indicates a pronounced lack of trading within that price range. Liquidity Voids are important because they highlight areas of minimal resistance, where price is more likely to return to fill the void and balance the market.
Liquidity Void vs Fair Value Gap
While both concepts are related to gaps in price action, they are distinct. A Fair Value Gap is a specific three-candle pattern where the middle candle creates a gap between the first and third candles. In contrast, a Liquidity Void represents a broader area on the chart where there is little to no trading activity, often encompassing multiple candles and indicating a more pronounced imbalance between buy and sell orders.
A FVG can be part of a Liquidity Void, a Liquidity Void can exist without necessarily including an FVG. Both concepts highlight areas of minimal resistance and potential price movement, but they differ in their formation and implications.
Advanced Market Structure and Order Blocks indicator focus on liquidity voids since a liquidity void can substitute for a FVG and it is usually less addressed by other indicators.

Morning RangeOverview
The Morning Range Indicator highlights the high and low of the market session from 6 AM to 10AM, providing key levels for potential breakout trades. The box dynamically updates in real-time, extending until 4 PM, and adjusts color based on price action.
This tool is ideal for traders looking to identify breakout opportunities and visualize key intraday price ranges.
How It Works
Session High & Low (6 AM - 10 AM)
The indicator tracks the highest high and lowest low within this time window.
Once 10 AM passes, the high and low are locked in and will not change.
Box Extends Until 4 PM
The session box remains visible throughout the trading day.
It provides a visual reference for potential breakout zones.
Dynamic Box Coloring
Gray (Neutral): Neither high nor low is broken.
Green: Only the high is broken before 4 PM.
Red: Only the low is broken before 4 PM.
Yellow: Both high and low are broken before 4 PM.
Live Updating Box
The box appears as soon as the session begins at 6 AM.
It dynamically updates the high and low until 10 AM.
Alerts for Breakouts
This indicator includes built-in alert conditions, so you can set up TradingView alerts without modifying the script.
Morning Range High Broken → Triggers when price breaks above the morning high.
Morning Range Low Broken → Triggers when price breaks below the morning low.
To set alerts:
Click the Alerts (⏰) icon in TradingView.
Select Condition → "Morning Range High Broken" or "Morning Range Low Broken".
Choose your preferred notification method (popup, email, webhook, etc.).
Click Create to activate the alert.
Who This Is For
✔ Intraday & Scalp Traders – Identify key breakout levels for short-term trades.
✔ Futures & Forex Traders – Works great for markets like NQ, ES, Gold, and FX pairs.
✔ Breakout & Reversal Traders – Use the high/low boundaries as support & resistance levels.
Customization
This indicator automatically updates every day and requires no manual input.
You can change alert settings via TradingView’s built-in alert system.
How to Use This Indicator
Watch for breakouts above/below the morning range as potential trade opportunities.
Combine with volume, momentum indicators, or footprint charts for confirmation.
Use the box color to visually assess whether price action is bullish (green), bearish (red), or ranging (gray).

Swing Breakout System (SBS)The Swing Breakout Sequence (SBS) is a trading strategy that focuses on identifying high-probability entry points based on a specific pattern of price swings. This indicator will identify these patterns, then draw lines and labels to show confirmation.
How To Use:
The indicator will show both Bullish and Bearish SBS patterns.
Bullish Pattern is made up of 6 points: Low (0), HH (1), LL (2 | but higher than initial Low), New HH (3), LL (5), LL again (5)
Bearish Patten is made up of 6 points: High (0), LL (1), HH (2 | but lower than initial high), New LL (3), HH (5), HH again (5)
A label with an arrow will appear at the end, showing the completion of a successful sequence
Idea behind the strategy:
The idea behind this strategy, is the accumulation and then manipulation of liquidity throughout the sequence. For example, during SBS sequence, liquidity is accumulated during step (2), then price will push away to make a new high/low (step 3), after making a minor new high/low, price will retrace breaking the key level set up in step (2). This is price manipulating taking liquidity from behind high/low from step (2). After taking liquidity price the idea is price will continue in the original direction.
Step 0 - Setting up initial direction
Step 1 - Setting up initial direction
Step 2 - Key low/high establishing liquidity
Step 3 - Failed New high/low
Step 4 - Taking liquidity from step (2)
Step 5 - Taking liquidity from step 2 and 4
Pattern Detection:
- Uses pivot high/low points to identify swing patterns
- Stores 6 consecutive swing points in arrays
- Identifies two types of patterns:
1. Bullish Pattern: A specific sequence of higher lows and higher highs
2. Bearish Pattern: A specific sequence of lower highs and lower lows
Note: Because the indicator is identifying a perfect sequence of 6 steps, set ups may not appear frequently.
Visualization:
- Draws connecting lines between swing points
- Labels each point numerically (optional)
- Shows breakout arrows (↑ for bullish, ↓ for bearish)
- Generates alerts on valid breakouts
User Input Settings:
Core Parameters
1. Pivot Lookback Period (default: 2)
- Controls how many bars to look back/forward for pivot point detection
- Higher values create fewer but more significant pivot points
2. Minimum Pattern Height % (default: 0.1)
- Minimum required height of the pattern as a percentage of price
- Filters out insignificant patterns
3. Maximum Pattern Width (bars) (default: 50)
- Maximum allowed width of the pattern in bars
- Helps exclude patterns that form over too long a period

HTF Hi-Lo Zones [CHE]HTF Hi-Lo Zones Indicator
The HTF Hi-Lo Zones Indicator is a Pine Script tool designed to highlight important high and low values from a selected higher timeframe. It provides traders with clear visual zones where price activity has reached significant points, helping in decision-making by identifying potential support and resistance levels. This indicator is customizable, allowing users to select the resolution type, control the visualization of session ranges, and even display detailed information about the chosen timeframe.
Key Functionalities
1. Timeframe Resolution Selection:
- The indicator offers three modes to determine the resolution:
- Automatic: Dynamically calculates the higher timeframe based on the current chart's resolution.
- Multiplier: Allows users to apply a multiplier to the current chart's timeframe.
- Manual: Enables manual input for custom resolution settings.
- Each resolution type ensures flexibility to suit different trading styles and strategies.
2. Data Fetching for High and Low Values:
- The indicator retrieves the current high and low values for the selected higher timeframe using `request.security`.
- It also calculates the lowest and highest values over a configurable lookback period, providing insights into significant price movements within the chosen timeframe.
3. Session High and Low Detection:
- The indicator detects whether the current value represents a new session high or low by comparing the highest and lowest values with the current data.
- This is crucial for identifying breakouts or significant turning points during a session.
4. Visual Representation:
- When a new session high or low is detected:
- Range Zones: A colored box marks the session's high-to-low range.
- Labels: Optional labels indicate "New High" or "New Low" for clarity.
- Users can customize colors, transparency, and whether range outlines or labels should be displayed.
5. Information Box:
- An optional dashboard displays details about the chosen timeframe resolution and current session activity.
- The box's size, position, and colors are fully customizable.
6. Session Tracking:
- Tracks session boundaries, updating the visualization dynamically as the session progresses.
- Displays session-specific maximum and minimum values if enabled.
7. Additional Features:
- Configurable dividers for session or daily boundaries.
- Transparency and styling options for the displayed zones.
- A dashboard for advanced visualization and information overlay.
Key Code Sections Explained
1. Resolution Determination:
- Depending on the user's input (Auto, Multiplier, or Manual), the script determines the appropriate timeframe resolution for higher timeframe analysis.
- The resolution adapts dynamically based on intraday, daily, or higher-period charts.
2. Fetching Security Data:
- Using the `getSecurityDataFunction`, the script fetches high and low values for the chosen timeframe, including historical and real-time data management to avoid repainting issues.
3. Session High/Low Logic:
- By comparing the highest and lowest values over a lookback period, the script identifies whether the current value is a new session high or low, updating session boundaries and initiating visual indicators.
4. Visualization:
- The script creates visual representations using `box.new` for range zones and `label.new` for session labels.
- These elements update dynamically to reflect the most recent data.
5. Customization Options:
- Users can configure the appearance, behavior, and displayed data through multiple input options, ensuring adaptability to individual trading preferences.
This indicator is a robust tool for tracking higher timeframe activity, offering a blend of automation, customization, and visual clarity to enhance trading strategies.
Disclaimer
The content provided, including all code and materials, is strictly for educational and informational purposes only. It is not intended as, and should not be interpreted as, financial advice, a recommendation to buy or sell any financial instrument, or an offer of any financial product or service. All strategies, tools, and examples discussed are provided for illustrative purposes to demonstrate coding techniques and the functionality of Pine Script within a trading context.
Any results from strategies or tools provided are hypothetical, and past performance is not indicative of future results. Trading and investing involve high risk, including the potential loss of principal, and may not be suitable for all individuals. Before making any trading decisions, please consult with a qualified financial professional to understand the risks involved.
By using this script, you acknowledge and agree that any trading decisions are made solely at your discretion and risk.
Best regards and happy trading
Chervolino

Weekly Opening Range and Previous Data for FuturesThis indicator will not predict future price action.
This indicator is a time based range tool. These types of tools are great to use when there is not any historical data to look back on (as in all time highs/lows). The user can use this indicator to measure distributions, use deviations of the range to identify support/resistance levels, and see how historical price action influences current price action. This indicator is unique because it uses the price range from the open of the futures market on Sunday 18:00 America/New York to the open of the Bond Market 8:00 America/New York as the range for all calculations.
This indicator collects the multiple points of data from each day of the week, and gives the user many options on how to use the data that is collected. The amount of data collected is based on the time frame of the chart (best used on a 15 minute chart), but is limited to 30 minute charts.
Data Collected:
Opening Range for the week
High of Each Day
Low of Each Day
Close of Each Day
Initially the range is plotted on the chart as a box, when the Bond market opens the high/low/mid is plotted, as well as the current week open and previous week close.
How the data is used.
Intraday: Monday does not have a previous day to pull data on, so all data for Monday is intraday data. When a new high is made, the indicator will search all previous data in the lookback period for the current day , find all highs that are within a set variance (determined by the user), and plot the corresponding lows from the matching days. It will do the same for new lows that are made, with corresponding historical highs. All of these levels are plotted on the chart, as well as the Average High, Average Low. If price moves beyond either Average, the Average of all days that distributed higher than the Average is plotted on the chart as Min/Max Average.
Previous Day Data: Tuesday - Friday. After the close of the day, the user has the option to choose either the High, Low, or Close of that day to find previous data that matches within a variance determined by the user; or an option to find the n closest matches (up to 20). That data is then matched to the corresponding next day data and plotted on the chart as a box. Example: Monday closes at +1 Deviation (Dev) of the Weekly Opening Range (WOR). The user sets the variance at 0.5 (0.5 Dev of the WOR), the indicator will search the lookback period for all Mondays that closed between 1.25 Dev and 0.75 Dev of the WOR. The matching Mondays will then be matched to their corresponding Tuesdays and the data for the High and Low from those Tuesdays will be placed on the chart as a box overlaying the current Tuesday. Each match is numbered so that corresponding Highs and Lows of each historical day can be identified. The same can be done for either the High or Low of the Previous Day.
The indicator has a table that can be shown.
Data shown in table:
Current Extension of the WOR
Maximum Extension of the WOR
Average WOR in %
Current WOR in %
Average Range for the day in % based on data set
Current Range for the day in %
Number of days in the data set
Number of Previous Day Matches
Variance for previous day data
Number of Intraday High Matches
Number of Intraday Low Matches
Variance for Intraday Matches
The table as well as all lines and boxes have the option of being shown or not, as well as have their settings customized to fit the users chart layout.
As with any indicator, do not let the data shown change your trading model. Past performance is not indicative to future performance.

supertrendLibrary "supertrend"
supertrend : Library dedicated to different variations of supertrend
supertrend_atr(length, multiplier, atrMaType, source, highSource, lowSource, waitForClose, delayed)
supertrend_atr: Simple supertrend based on atr but also takes into consideration of custom MA Type, sources
Parameters:
length (simple int) : : ATR Length
multiplier (simple float) : : ATR Multiplier
atrMaType (simple string) : : Moving Average type for ATR calculation. This can be sma, ema, hma, rma, wma, vwma, swma
source (float) : : Default is close. Can Chose custom source
highSource (float) : : Default is high. Can also use close price for both high and low source
lowSource (float) : : Default is low. Can also use close price for both high and low source
waitForClose (simple bool) : : Considers source for direction change crossover if checked. Else, uses highSource and lowSource.
delayed (simple bool) : : if set to true lags supertrend atr stop based on target levels.
Returns: dir : Supertrend direction
supertrend : BuyStop if direction is 1 else SellStop
supertrend_bands(bandType, maType, length, multiplier, source, highSource, lowSource, waitForClose, useTrueRange, useAlternateSource, alternateSource, sticky)
supertrend_bands: Simple supertrend based on atr but also takes into consideration of custom MA Type, sources
Parameters:
bandType (simple string) : : Type of band used - can be bb, kc or dc
maType (simple string) : : Moving Average type for Bands. This can be sma, ema, hma, rma, wma, vwma, swma
length (simple int) : : Band Length
multiplier (float) : : Std deviation or ATR multiplier for Bollinger Bands and Keltner Channel
source (float) : : Default is close. Can Chose custom source
highSource (float) : : Default is high. Can also use close price for both high and low source
lowSource (float) : : Default is low. Can also use close price for both high and low source
waitForClose (simple bool) : : Considers source for direction change crossover if checked. Else, uses highSource and lowSource.
useTrueRange (simple bool) : : Used for Keltner channel. If set to false, then high-low is used as range instead of true range
useAlternateSource (simple bool) : - Custom source is used for Donchian Chanbel only if useAlternateSource is set to true
alternateSource (float) : - Custom source for Donchian channel
sticky (simple bool) : : if set to true borders change only when price is beyond borders.
Returns: dir : Supertrend direction
supertrend : BuyStop if direction is 1 else SellStop
supertrend_zigzag(length, history, useAlternativeSource, alternativeSource, source, highSource, lowSource, waitForClose, atrlength, multiplier, atrMaType)
supertrend_zigzag: Zigzag pivot based supertrend
Parameters:
length (simple int) : : Zigzag Length
history (simple int) : : number of historical pivots to consider
useAlternativeSource (simple bool)
alternativeSource (float)
source (float) : : Default is close. Can Chose custom source
highSource (float) : : Default is high. Can also use close price for both high and low source
lowSource (float) : : Default is low. Can also use close price for both high and low source
waitForClose (simple bool) : : Considers source for direction change crossover if checked. Else, uses highSource and lowSource.
atrlength (simple int) : : ATR Length
multiplier (simple float) : : ATR Multiplier
atrMaType (simple string) : : Moving Average type for ATR calculation. This can be sma, ema, hma, rma, wma, vwma, swma
Returns: dir : Supertrend direction
supertrend : BuyStop if direction is 1 else SellStop
zupertrend(length, history, useAlternativeSource, alternativeSource, source, highSource, lowSource, waitForClose, atrlength, multiplier, atrMaType)
zupertrend: Zigzag pivot based supertrend
Parameters:
length (simple int) : : Zigzag Length
history (simple int) : : number of historical pivots to consider
useAlternativeSource (simple bool)
alternativeSource (float)
source (float) : : Default is close. Can Chose custom source
highSource (float) : : Default is high. Can also use close price for both high and low source
lowSource (float) : : Default is low. Can also use close price for both high and low source
waitForClose (simple bool) : : Considers source for direction change crossover if checked. Else, uses highSource and lowSource.
atrlength (simple int) : : ATR Length
multiplier (simple float) : : ATR Multiplier
atrMaType (simple string) : : Moving Average type for ATR calculation. This can be sma, ema, hma, rma, wma, vwma, swma
Returns: dir : Supertrend direction
supertrend : BuyStop if direction is 1 else SellStop
zsupertrend(zigzagpivots, history, source, highSource, lowSource, waitForClose, atrMaType, atrlength, multiplier)
zsupertrend: Same as zigzag supertrend. But, works on already calculated array rather than Calculating fresh zigzag
Parameters:
zigzagpivots (array) : : Precalculated zigzag pivots
history (simple int) : : number of historical pivots to consider
source (float) : : Default is close. Can Chose custom source
highSource (float) : : Default is high. Can also use close price for both high and low source
lowSource (float) : : Default is low. Can also use close price for both high and low source
waitForClose (simple bool) : : Considers source for direction change crossover if checked. Else, uses highSource and lowSource.
atrMaType (simple string) : : Moving Average type for ATR calculation. This can be sma, ema, hma, rma, wma, vwma, swma
atrlength (simple int) : : ATR Length
multiplier (simple float) : : ATR Multiplier
Returns: dir : Supertrend direction
supertrend : BuyStop if direction is 1 else SellStop

TheHorsyAlgoPROThe Horsy algo is an automated strategy that uses any minute Higher timeframe range as reference and search for a purge of liquidity on the HTF high or low where buyside or sell side liquidity is, the algo only search this at specific desired times that can be configured according to the time you usually trade, the strategy is known as Turtle soup purge and reverse or lately as CRT.
Why is useful?
The purpose of this Algorithm is to help turtle soup traders to quickly identify when the market is likely to reverse the algo evaluates if the opportunity is worth it, base on risk reward and other desired filters. Also this strategy can help to quickly backtest the trader strategy it can be configured in different timeframes and adapt to the trader personality, they can easily see the results and statistics and notice if its profitable or not.
This algo is useful for intraday traders looking for a purge and reverse at a key times and at key HTF price levels this only looks the previous HTF highs and lows but is important to also monitor Order blocks, FVGs, gaps, or wicks to have the best results.
How it works and how it does it?
The Horsy algo simply Jumps from one type of liquidity to another one buyside to sell side or vice versa. In order for the algo to trigger an entry it has to meet these conditions
1. Take HTF liquidity, trade above a HTF high or below a HTF low in the selected time window
2. Make a change in the state of delivery with a close below the previous candle low for shorts and close above previous candle high for longs.
3. Allow for a reasonable risk reward, it will use the highest high for shorts and the lowest low for longs. The default take profit is the opposite side of the range.
4. Validate others user filters this include enter only trades aligned with the HTF bias, or trades aligned with the LTF bias or booth. The algo have the option to enter only premium and discount entries. And finally, an option to allow for different contract sizes depending of the maximum percent of the account we want to risk default is 1%. For this last option is important to check the initial balance and leverage are configured correctly, is disable by default because it requires more capital to perform well.
We can see the algo performing in the picture below with a short trade, notice there are some white lines, they are the high or the low of HTF candle that start generating inside candles in the HTF meaning a possible consolidation. The algo plots the HTF ranges in a shaded boxes as you can see below
The HTF bias as you can see in the picture is calculated based on the last close of the HTF meaning close above previous HTF high is bullish close below previous HTF low is bearish. This HTF bias level is also the last HTF mid-price or 50%. By default, this line is enabled.
The LTF bias is calculated based on the range created from the expansion outside the previous HTF range is also the mid-price. If the LTF close above previous HTF high is bullish and if the LTF close below previous HTF low is bearish. By default this LTF bias line is disable.
This strategy includes an original and personal developed code that uses dealing ranges to recognize if the market is expanding, retracing, reversing or consolidating. This allow the algo to exit the position when it detects a retracement or at the end of the expansion. This is the default exit type.
You can monitor the previous dealing ranges created in history with an option than can be enable, by default is disable, this ranges are created after price takes buyside and then sell side or vice versa. So this dealing ranges can be useful also to identify minor pools of liquidity and premium and discount in the lower timeframe.
The picture below is a long example, the exit in this case is just at the high of the range. The normal take profit is in a blue line for longs.
How to use it?
First select the desired HTF timeframe recommended is from 30min to 240min then you setup the chart on the lower timeframe you want to trade recommended is from 1min to 15min to enter. By default This strategy is designed to work for intraday during key times when price take stops and then moves quickly away from them. You can select as much as 6 different times or just one. After you select the desired time window where the algo will look for the purge and reverse, They are highlighted in the candles that change colors excluding the gray ones that indicates consolidation.
Then the Algo allow to performs several additional filters in the entries you can select if you want to trade only longs or shorts trades, you can select when to move the stop loss to Break even. In deviations of the risk or you can just select to remove risk when price hits the 50% of previous HTF range.
You can select the minimum desired risk reward of the trade before is allow to be taken. Once is configured correctly the algo should trigger signals with a triangle up or down plus the strategy entry.
At the beginning of the picture there are some blue lines in the HTF high low and close, this is to easily identify that the market is in the Asia session, the time can be configured by the user, these lines are normally gray.
On the right top of the screen you can see some statistics about the strategy how many trades it took, ARR is an approximated value of the accumulated total risk reward of all the trades when they get closed in the simulation.
Profit factor and percent profitable are also shown should be green it means that the strategy makes money over time. But apart from that is important to notice how it makes money it is stable over time? it is a roller coaster? that why I Include this other measurements MxcsTps is the maximum consecutives take profits and Mxcsls is the maximum consecutive stop losses it takes, the slash number after it is the consecutive Break evens. So this way you know what to expect and what is normal in the strategy.
The algo shows all the times the stop loss, take profit and break even level if enable in the colored red lines for short and blue lines for longs. You can also select how price will manage the profit or stoploss point meaning that you can choose to wait for the candle to close to invalidate your idea or to take profit. This is good to avoid liquidity sweeps but can also lead to mayor loses if the idea is wrong. The default setting is to close the trade when price takes the high or low where the stoploss is, the take profit is taken after a retracement to allow to profit on expansions. You can select also to exit on a reversal if you want to ride all the move. This last option has to be used with caution because sometimes price just retrace or reverse very fast decreasing the trade profit and overall strategy performance.
The algo have the option to use standard deviation from the normal risk if you prefer to prevent liquidity sweeps near the stop level this make wider stops but can lead to increased loses so it has to be used carefully.
Below is a picture that show the entry stop and take profit levels with an exit on a retracement activated.
Strategy Results
The backtesting results are obtained simulating a 2000usd account in the Micro Nasdaq using 1 contract per trade. Commission are set to 2usd per contract, slippage to 1tick. You can see in list of trades we are not risking more than 1 % percent of the account. The backtested range is from august to November 2024. This strategy doesn’t generate too much trades because of the time filters and conditions that has to be meet to take an entry but you can see the results of the last 4months with the available data that are around 32 trades.
The default settings for this strategy is HTF as 240min designed to work on a LTF 5min chart, the default purge times are 245-300, 745-800, 845-900, 1045-1100 and 1245-1300 UTC-4, the algo will look for shorts or longs, with a minimum risk reward of 2.0. With an additional filter of the HTFBias. The take profit is by default taken on the first retracement after hitting the target. The default settings are optimized to work on the Nasdaq or Spy, but can also perform well in other assets with the correct adjustments.
Remember entries constitute only a small component of a complete winning strategy. Other factors like risk management, position-sizing, trading frequency, trading fees, and many others must also be properly managed to achieve profitability. Past performance doesn’t guarantee future results. To really take advantage of this strategy you have to study turtle soup and the HTF key levels use this only as a confirmation that your overall idea will play out and use it to backtest your model.
Summary of features
·Adaptable strategy to different HTF timeframes from 1-1440min
· Select up to 6 different purge time windows UTC-4, UTC-5
· Choose desired Risk Reward per trade
· Easily see the HTF high low close and 50% key levels in the LTF
· Identify HTF consolidations that generate key major liquidity pools
· HTF/LTF bias filters to trade in favor of the big trend or in sync
· Shaded boxes that indicate if the market is bullish, bearish or consolidating
· See the current midpoint of the last expansion move
· Optimal trade entry filter to trade only in a discount or premium
· Customizable trade management take profit, stop, breakeven level
· Option to exit on a close, retracement or reversal after hitting the take profit level
· Option to exit on a close or reversal after hitting stop loss
· Configurable breakeven point with standard deviations or at 50% of the HTF
· Calculate different contract sizes depending of a percentage of the initial balance
· Standard deviations from normal risk can be used to prevent liquidity sweeps
· See dealing ranges history to check minor pools of liquidity and premium or discount
· Dashboard with instant statistics about the strategy current settings

UVR Crypto TrendINDICATOR OVERVIEW: UVR CRYPTO TREND
The UVR Crypto Trend indicator is a custom-built tool designed specifically for cryptocurrency markets, utilizing advanced volatility, momentum, and trend-following techniques. It aims to identify trend reversals and provide buy and sell signals by analyzing multiple factors, such as price volatility(UVR), RSI (Relative Strength Index), CMF (Chaikin Money Flow), and EMA (Exponential Moving Average). The indicator is optimized for CRYPTO MARKETS only.
KEY FEATURES AND HOW IT WORKS
Volatility Analysis with UVR
The UVR (Ultimate Volatility Rate) is a proprietary calculation that measures market volatility by comparing significant price extremes and smoothing the data over time.
Purpose: UVR aims to reduce noise in low-volatility environments and highlight significant movements during higher-volatility periods. While it strives to improve filtering in low-volatility conditions, it does not guarantee perfect performance, making it a balanced and adaptable tool for dynamic markets like cryptocurrency.
HOW UVR (ULTIMATE VOLATILITY RATE) IS CALCULATED
UVR is calculated using a method that ensures precise measurement of market volatility by comparing price extremes across consecutive candles:
Volatility Components:
Two values are calculated to represent potential price fluctuations:
The absolute difference between the current candle's high and the previous candle's low:
Volatility Component 1=∣High−Low ∣
The absolute difference between the previous candle's high and the current candle's low:
Volatility Component 2=∣High −Low∣
Volatility Ratio:
The larger of the two components is selected as the Volatility Ratio, ensuring UVR captures the most significant movement:
Volatility Ratio=max(Volatility Component 1,Volatility Component 2)
Smoothing with SMMA:
To stabilize the volatility calculation, the Volatility Ratio is smoothed using a Smoothed Moving Average (SMMA) over a user-defined period (e.g., 14 candles):
UVR=(UVR(Previous)×(Period−1)+Volatility Ratio)/Period
This calculation ensures UVR adapts dynamically to market conditions, focusing on significant price movements while filtering out noise.
RSI FOR MOMENTUM DETECTION
RSI (Relative Strength Index) identifies overbought and oversold conditions.
Trend Confirmation at the 50 Level
RSI values crossing above 50 signal the potential start of an upward trend.
RSI values crossing below 50 indicate the potential start of a downward trend.
Key Reversals at Extreme Levels
RSI detects trend reversals at overbought (>70) and oversold (<30) levels.
For example:
Overbought Trend Reversal: RSI >70 followed by bearish price action signals a potential downtrend.
Oversold Trend Reversal: RSI <30 with bullish confirmation signals a potential uptrend.
Rare Extreme RSI Readings
Extreme levels, such as RSI <12 (oversold) or RSI >88 (overbought), are used to identify rare yet powerful reversals.
---HOW IT DIFFERS FROM OTHER INDICATORS---
Using UVR High and Low Values
The Ultimate Volatility Rate (UVR) focuses on analyzing the high and low price ranges of the market to measure volatility.
Unlike traditional trend indicators that rely primarily on momentum or moving average crossovers, UVR leverages price extremes to better identify trend reversals.
This approach ensures fewer false signals during low-volatility phases and more accurate trend detection during high-volatility conditions.
UVR as the Core Component
The indicator is fundamentally built around UVR as the primary filter, while supporting tools like RSI (momentum detection), CMF (volume confirmation), and EMA (trend validation) complement its functionality.
By integrating these additional components, the indicator provides a multidimensional analysis rather than relying solely on a single approach.
Dynamic Adaptation to Volatility
UVR dynamically adjusts to market conditions, striving to improve filtering in low-volatility phases. While not flawless, this approach minimizes false signals and adapts more effectively to varying levels of market activity.
Trend Clouds for Visual Guidance
UVR-based dynamic clouds visually mark high and low price areas, highlighting potential consolidation or retracement zones.
These clouds serve as guides for setting stop-loss or take-profit levels, offering clear risk management strategies.
BUY AND SELL SIGNAL LOGIC
BUY CONDITIONS
Momentum-Based Buy-Entry
RSI >50, CMF >0, and the close price is above EMA50.
The price difference between open and close exceeds a threshold based on UVR.
Oversold Reversal
RSI <30 and CMF >0 with a strong bullish candle (close > open and UVR-based sensitivity filter).
Breakout Confirmation
The price breaks above a previously identified resistance, with conditions for RSI and CMF supporting the breakout.
Reversal from Oversold RSI Extreme
RSI <12 on the previous candle with a strong rebound on the current candle with UVR confirmation filter.
SELL CONDITIONS
Momentum-Based Sell-Entry
RSI <50, CMF <0, and the close price is below EMA50.
The price difference between open and close exceeds the UVR threshold.
Overbought Reversal
RSI >70 with bearish price action (open > close and UVR-based sensitivity filter).
Breakdown Confirmation
The price breaks below a previously identified support, with RSI and CMF supporting the breakdown.
Reversal from Overbought RSI Extreme
RSI >88 on the previous candle with a bearish confirmation on the current candle with UVR confirmation filter.
BUY AND SELL SIGNALS VISUALIZATION
The UVR Crypto Trend Indicator visually represents buy and sell conditions using dynamic plots, making it easier for traders to interpret and act on the signals. Below is an explanation of the visual representation:
Buy Signals and Visualization
Signal Trigger:
A buy signal is generated when one of the defined Buy Conditions is met (e.g., RSI >50, CMF >0, price above EMA50).
Visual Representation:
A blue upward arrow appears at the candle where the buy condition is triggered.
A blue cloud forms above the price candles, representing the strength of the bullish trend. The cloud dynamically adapts to market volatility, using the UVR calculation to mark support zones or consolidation levels.
Purpose of the Blue Cloud:
It acts as a visual guide for price movements and stay horizontal when the trend is not moving up
Sell Signals and Visualization
Signal Trigger:
A sell signal is generated when one of the defined Sell Conditions is met (e.g., RSI <50, CMF <0, price below EMA50).
Visual Representation:
A red downward arrow appears at the candle where the sell condition is triggered.
A red cloud forms below the price candles, representing the strength of the bearish trend. Like the blue cloud, it uses the UVR calculation to dynamically mark resistance zones or potential retracement levels.
Purpose of the Red Cloud:
It acts as a visual guide for price movements and stay horizontal when the trend is not moving down.
CONCLUSION
The UVR Crypto Trend indicator provides a powerful tool for trend reversal detection by combining volatility analysis, momentum confirmation, and trend-following techniques. Its unique use of the Ultimate Volatility Rate (UVR) as a core element, supported by proven indicators like RSI, CMF, and EMA, ensures reliable and actionable signals tailored for the crypto market's dynamic nature. By leveraging UVR’s high and low price range analysis, it achieves a level of precision that traditional indicators lack, making it a high-performing system for cryptocurrency traders.

Trading Sessions with Highs and LowsTrading Sessions with Highs and Lows is designed to visually highlight specific trading sessions on the chart, providing traders with key insights into market behavior during these time periods. Here’s a detailed explanation of how the indicator works:
Key Features
1. Session Boxes:
• The indicator plots colored boxes on the chart to represent the price range of defined trading sessions.
• Each box spans the session’s start and end times and encapsulates the high and low prices during that period.
• Two trading sessions are defined by default:
• USA Trading Session: 9:30 AM - 4:00 PM (New York Time).
• UK Trading Session: 8:00 AM - 4:30 PM (London Time).
2. Session Labels:
• The name of the session (e.g., “USA” or “UK”) is displayed above the session box for clear identification.
3. High and Low Markers:
• Markers are added to the chart at the session’s high and low points:
• High Marker: A green label indicating the session high.
• Low Marker: A red label indicating the session low.
4. Dynamic Reset:
• After the session ends, the session high and low values are reset to na to prepare for the next trading day.
5. Customizable Background Colors:
• Each session’s box has a distinct, semi-transparent background color for better visual separation.
How It Works
1. Core Functionality:
• A function, plot_box, takes the session name, start time, end time, and background color as input.
• It calculates whether the current time is within the session.
• During the session:
• It tracks the session’s highest and lowest prices.
• It identifies the bars where the high and low occurred.
• At the session’s end:
• It plots a box on the chart covering the session’s time and price range.
• Labels are created for the session name and its high/low points.
2. Session Timing:
• Timestamps for the USA and UK trading sessions are calculated using the timestamp function with respective time zones.
3. Visual Elements:
• The box.new function draws the session boxes on the chart.
• The label.new function creates session name and high/low labels.
Usage
• Overlay Mode: The indicator is applied directly on the price chart (overlay=true), making it easy to visualize session-specific price behavior.
• Trading Strategy:
• Identify session-specific support and resistance levels.
• Observe price action trends during key trading periods.
• Align trading decisions with session dynamics.
Customization
While the indicator is preset for the USA and UK trading sessions, it can be easily modified:
1. Add/Remove Sessions: Define additional sessions by providing their start and end times.
2. Change Colors: Update the background_color in the plot_box calls to use different colors for sessions.
3. Adjust Time Zones: Replace the current time zones with others relevant to your trading style.
Visualization Example
• USA Session:
• Time: 9:30 AM - 4:00 PM (New York Time).
• Box Color: Semi-transparent orange.
• UK Session:
• Time: 8:00 AM - 4:30 PM (London Time).
• Box Color: Semi-transparent green.
Why Use This Indicator?
1. Market Awareness: Easily spot price behavior during high-liquidity trading periods.
2. Trend Analysis: Analyze how sessions overlap or affect each other.
3. Session Boundaries: Use session high/low levels as dynamic support and resistance zones.
This indicator is an essential tool for intraday and swing traders who want to align their strategies with key market timings.

MarketStructureLibrary "MarketStructure"
Will draw out the market structure for the disired pivot length. The code is from my indicator "Marker structure" ().
Create(type, length, source, equalPivotsFactor, extendEqualPivotsZones, equalPivotsStyle, equalPivotsColor, alertFrequency)
Call on each bar. Will create a Structure object.
Parameters:
type (int) : the type of the Structure to create. 0 = internal, 1 = swing.
length (int) : The lenghts (left and right) for pivots to use.
source (string) : The source to be used for structural changes ('Close', 'High/low (aggresive)' (low in an uptrend) or 'High/low (passive)' (high in an uptrend)).
equalPivotsFactor (float) : Set how the limits are for an equal pivot. This is a factor of the Average True Length (ATR) of length 14. If a low pivot is considered to be equal if it doesn't break the low pivot (is at a lower value) and is inside the previous low pivot + this limit.
extendEqualPivotsZones (bool) : Set to true if you want the equal pivots zones to be extended.
equalPivotsStyle (string) : Set the style of equal pivot zones.
equalPivotsColor (color) : Set the color of equal pivot zones.
alertFrequency (string)
Returns: The 'structure' object.
Pivot(structure)
Sets the pivots in the structure.
Parameters:
structure (Structure)
Returns: The 'structure' object.
PivotLabels(structure)
Draws labels for the pivots found.
Parameters:
structure (Structure)
Returns: The 'structure' object.
EqualHighOrLow(structure)
Draws the boxsa for equal highs/lows. Also creates labels for the pivots included.
Parameters:
structure (Structure)
Returns: The 'structure' object.
BreakOfStructure(structure)
Will create lines when a break of strycture occures.
Parameters:
structure (Structure)
Returns: The 'structure' object.
ChangeOfCharacter(structure)
Will create lines when a change of character occures.
Parameters:
structure (Structure)
Returns: The 'structure' object.
StructureBreak
Holds drawings for a structure break.
Fields:
Line (series line) : The line object.
Label (series label) : The label object.
Pivot
Holds all the values for a found pivot.
Fields:
Price (series float) : The price of the pivot.
BarIndex (series int) : The bar_index where the pivot occured.
Type (series int) : The type of the pivot (-1 = low, 1 = high).
ChangeOfCharacterBroken (series bool) : Sets to true if a change of character has happened.
BreakOfStructureBroken (series bool) : Sets to true if a break of structure has happened.
Structure
Holds all the values for the market structure.
Fields:
Length (series int) : Define the left and right lengths of the pivots used.
Type (series int) : Set the type of the market structure. Two types can be used, 'internal' and 'swing' (0 = internal, 1 = swing).
Trend (series int) : This will be set internally and can be -1 = downtrend, 1 = uptrend.
Source (series string) : Set the source for structural chandeg. Can be 'Close', 'High/low (aggresive)' (low in an uptrend) or 'High/low (passive)' (high in an uptrend).
EqualPivotsFactor (series float) : Set how the limits are for an equal pivot. This is a factor of the Average True Length (ATR) of length 14. If a low pivot is considered to be equal if it doesn't break the low pivot (is at a lower value) and is inside the previous low pivot + this limit.
ExtendEqualPivotsZones (series bool) : Set to true if you want the equal pivots zones to be extended.
ExtendEqualPivotsStyle (series string) : Set the style of equal pivot zones.
ExtendEqualPivotsColor (series color) : Set the color of equal pivot zones.
EqualHighs (array) : Holds the boxes for zones that contains equal highs.
EqualLows (array) : Holds the boxes for zones that contains equal lows.
BreakOfStructures (array) : Holds all the break of structures within the trend (before a change of character).
Pivots (array) : All the pivots in the current trend, added with the latest first, this is cleared when the trend changes.
AlertFrequency (series string) : set the frequency for alerts.
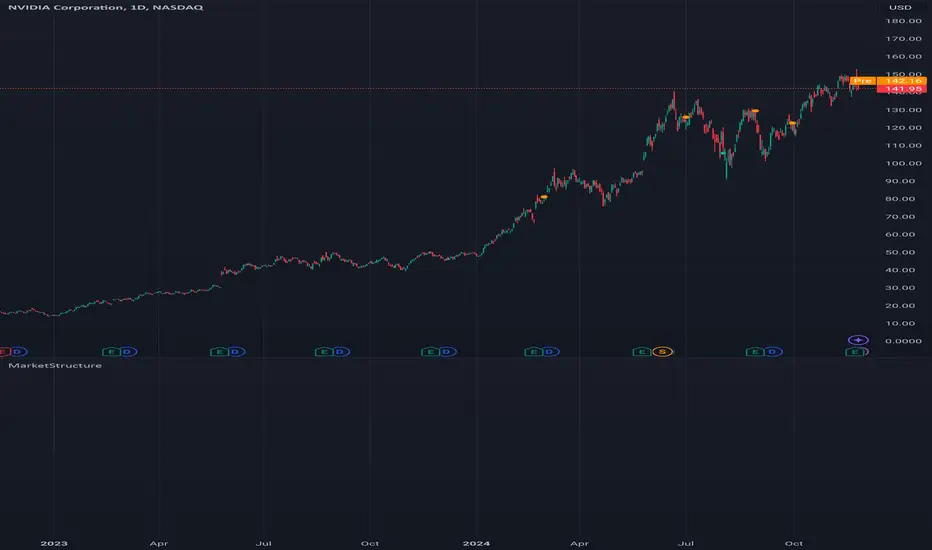
BOS TRADER [v 1.0] [Influxum]The name of the tool, BOS Trader, comes from the abbreviation BOS, which stands for Break Of Structure. In simple terms, this tool identifies situations where a change in market structure occurs after liquidity has been grabbed. Following the structural change, it looks for a point where the balance between buyers and sellers will be tested, potentially continuing the price movement in the direction of the structural break.
The goal of this tool is to identify areas where a trader can look for potential entry opportunities based on their entry rules and filters. In our own research, we found that while this tool is not a standalone strategy, it provides a statistical advantage that stems from the nature of the market itself. If you expect the market to reverse at a certain price level against a short-term, medium-term, or long-term trend, that reversal must logically begin with a change in structure – i.e., its break. BOS Trader then highlights the zone where you can expect a strong reaction from traders speculating on the continuation of price in the direction of the break.
Another important piece of the puzzle is the concept of liquidity. Liquidity grabs are generally considered by traders to be events that can trigger market direction changes. That's why BOS Trader is complemented with multiple ways to identify liquidity in the market from a Price Action perspective. We have explored the liquidity concept in depth in our other tools – the Liquidity Tool and Liquidity Strategy Tester – so we won’t go into too much detail on liquidity settings here.
🟪 Pivots
Liquidity can be found beyond pivot extremes – the highest candles in a series of candles. The pivot liquidity setting specifies how many candles must be before and after the pivot candle with a lower high for a pivot high or a higher low for a pivot low. A pivot high is the local highest point of the last 31 candles (15 before the pivot candle, the pivot candle itself, and 15 after). Another option is to set the time period in which the pivot extreme must occur. For example, you can differentiate between pivot highs of the Asian or London session.
🟪 % Percent Change
This setting is based on the well-known Zig Zag indicator and confirms swing highs or swing lows when there is a certain percentage change in price. This helps filter out noise that can occur when the market consolidates and randomly creates pivot highs or lows that aren’t significant.
🟪 Session High/Low
Many popular strategies are based on liquidity defined as the price range of a specific trading session. This doesn't have to be London, Asia, or New York sessions, but could be, for instance, the first hour of the New York session, and so on.
🟪 Day High/Low, Week High/Low, Month High/Low
As the name suggests, liquidity is often defined by the high/low of the previous day, week, or month. These price levels are watched by many market participants, and it's reasonable to expect reactions at these levels. That’s why we included this option in the BOS tool.
Tip for Traders
To avoid common issues with setting the correct session time, we have added the BG option to the tool – the ability to display a background for the configured trading session. This makes it easy to verify that your trading session is set correctly in relation to your time zone.
Delete grabbed liquidity
If a liquidity level is breached by price, it becomes invalid. For those who prefer to keep their charts clean and uncluttered, there is an option to delete grabbed liquidity. This way, only untraded, valid liquidity lines will be visible on the chart.
Bars after liquidity grab
A liquidity grab should be a significant event that triggers a reaction from market participants. To ensure this is a real response to liquidity rather than random market behavior, we added a time test to the BOS tool. A structural break must occur within a specified time after the liquidity grab. You can define this time in the tool as the number of bars after which the structural break is still considered valid following the liquidity grab.
🟪 AOI (Area of Interest) Settings
Initially, it's important to note that there are two main options for setting the behavior of the AOI. The first option is to fix its duration by the number of bars – Duration, and the second is to keep the AOI valid until it is traded through – Extended.
Duration
Since we expect a quick reaction to the liquidity grab, we also expect a fast pullback to the AOI and a swift response of traders. Our research has shown that the strongest reactions typically occur within a maximum of 15 bars from the formation of the AOI (fractally across timeframes). Therefore, this value is set as the default. However, we recommend considering not just the speed of the reaction but also its intensity. After the set number of bars, the AOI stops extending further.
Extended
We have noticed that price has a tendency to return to the AOI even after a longer period and react again. For this reason, we included the option in the BOS tool to extend the AOI into the future, with the ability to freely adjust the Max AOI Length.
🟪 AOI Size Mode
There are two options for setting the size of the AOI. Either it can be calculated as a percentage of the swing size (% of swing) in which the structural break occurred (the default setting is 30%), or you can set a different concept for the AOI size. For example, the well-known Optimal Trade Entry model. Custom values can be set in the FIBO Levels option, where you can define either preferred Fibonacci values or values based on your own criteria.
🟪 Trading Session (signals + alerts + visibility)
The main goal of our tools is to make it easier for traders to identify patterns and opportunities in the market and allow them to be alerted to their occurrence. The time for AOI plotting after a liquidity grab is combined into a single Trading Session function. This controls both the AOI plotting and when the tool will send alerts. All of this is aimed at helping traders avoid spending the entire day in front of their monitors, waiting for trading opportunities. Here, too, you can use the BG feature to plot a background on the chart showing the current session.
🟪 Trading within session range
We found that some traders have difficulty navigating the many AOIs plotted during times when the market consolidates and creates numerous false breakouts. Therefore, we included an option in the BOS tool to track only structural changes at the price extremes of the current day and trading session. The tool will not plot structural changes for internal liquidity grabs (within the session range), but only for external liquidity grabs (highest highs and lowest lows of the session or liquidity from previous days).
Visuals
The BOS tool is, of course, supplemented with the option to customize the appearance of all its components according to your preferences.

Enhanced MACD Swing Analysis增強版 MACD 擺動分析
概述
增強版 MACD 擺動分析是一個適用於 TradingView 的技術指標,它通過額外的視覺工具增強了傳統的 MACD(移動平均收斂背離),以幫助識別擺動高點和低點。該指標旨在幫助交易者可視化動能的變化,並更準確地確定市場進出位置。它提供基於可自定義閾值的動態顏色變化直方圖,並直接在圖表上繪製擺動高/低點的線條,方便分析。
功能
MACD 計算:該腳本包括傳統的 MACD 計算,並且允許調整快速長度、慢速長度和信號平滑參數。
擺動高/低點檢測:根據用戶定義的回看週期,自動檢測擺動高點和低點,並在圖表右上角顯示這些數值。
動態顏色變化直方圖:根據 MACD 比率動態改變直方圖的顏色,使交易者可以輕鬆識別不同的動能強度。顏色可以自定義,正負動能都有多種色調。
擺動高/低點線條:繪製線條以視覺化顯示擺動高點和低點,並向右延伸這些線條,以便更好地視覺指引。
參數
快速長度 (MACD Fast Length):計算快速移動平均的週期數。預設值為 12。
慢速長度 (MACD Slow Length):計算慢速移動平均的週期數。預設值為 26。
信號平滑 (MACD Signal Smoothing):平滑 MACD 信號線的週期數。預設值為 9。
擺動回看範圍 (Swing Lookback Range):回看多少根 K 線以檢測擺動高點和低點。預設值為 25。
顏色變化比率 (Color Change Ratios):逗號分隔的比率,用於定義直方圖顏色變化的閾值。這些閾值允許用戶自定義何時基於 MACD 比率改變直方圖的顏色強度。提供了默認值。
工作原理
MACD 計算:該腳本使用用戶定義的快速和慢速長度,以及信號線平滑來計算 MACD。
直方圖顏色變化:根據 MACD 線和信號線之間的差值,計算比率以確定直方圖顏色的強度。顏色根據用戶指定的閾值進行變化,以視覺化顯示動能的變化。
擺動高/低點檢測:腳本回看一定數量的 K 線來檢測擺動高點和低點,並在圖表上繪製向右延伸的線條,方便識別。
使用方法
添加到圖表:將指標應用到您的 TradingView 圖表上,以更清晰地可視化 MACD 動能。
調整參數:根據您的交易風格自定義參數。您可以調整 MACD 長度、擺動回看範圍和顏色變化閾值。
解讀信號:使用顏色編碼的直方圖來判斷動能的強弱和方向。擺動高/低點線條有助於識別潛在的市場反轉或進出場位置。
實際應用
動能分析:使用顏色變化直方圖來評估趨勢的強度。顏色越亮表示動能越強,顏色越暗表示趨勢減弱。
擺動識別:擺動高/低點線條便於識別價格可能反轉的支撐和阻力區域。
進出場信號:當直方圖顏色強度變化時,這可能是動能轉變的早期信號,提供潛在的買入或賣出機會。
自定義
該指標高度可自定義,允許交易者修改 MACD 參數、擺動回看範圍和顏色變化閾值。這種靈活性使其適合於不同的交易風格,無論是日內交易者、擺動交易者,還是長期投資者。
Enhanced MACD Swing Analysis
Overview
The Enhanced MACD Swing Analysis script is a technical indicator for TradingView that enhances the traditional MACD (Moving Average Convergence Divergence) with additional visual tools to identify swing highs and swing lows. This indicator is designed to help traders visualize momentum shifts and determine market entry/exit points with greater accuracy. It provides dynamic color-changing histograms based on customizable thresholds and draws swing high/low lines directly on the chart for easy analysis.
Features
MACD Calculation: The script includes the traditional MACD calculation, with adjustable parameters for fast length, slow length, and signal smoothing.
Swing High/Low Detection: Automatically detects swing highs and lows based on a user-defined lookback period and displays the values in the top-right corner of the chart.
Dynamic Color-Changing Histogram: The histogram colors change dynamically based on the MACD ratio, allowing traders to easily identify different levels of momentum. The colors are customizable, with a variety of shades for both positive and negative momentum.
Swing High/Low Lines: Draws lines to visually indicate swing highs and lows, extending these lines to the right for better visual guidance.
Parameters
快速長度 (MACD Fast Length): The number of periods for the fast moving average. Default is 12.
慢速長度 (MACD Slow Length): The number of periods for the slow moving average. Default is 26.
信號平滑 (MACD Signal Smoothing): The number of periods for smoothing the MACD signal line. Default is 9.
擺動回看範圍 (Swing Lookback Range): The number of bars to look back for detecting swing highs and lows. Default is 25.
顏色變化比率 (Color Change Ratios): Comma-separated values for defining the ratios at which histogram colors change. These thresholds allow users to customize when the histogram changes its color intensity based on the MACD ratio. Default values are provided.
How It Works
MACD Calculation: The script calculates the MACD using the user-defined fast and slow lengths, along with a signal line for smoothing.
Histogram Color Change: Based on the difference between the MACD line and the signal line, a ratio is calculated to determine the intensity of the histogram's color. The color changes depending on user-specified thresholds to visually indicate shifts in momentum.
Swing High/Low Detection: The script looks back over a specified number of bars to detect swing highs and lows, which are then plotted on the chart using lines that extend to the right for easier identification.
How to Use
Add to Chart: Apply the indicator to your TradingView chart to visualize MACD momentum with enhanced clarity.
Adjust Parameters: Customize the parameters to suit your trading style. You can adjust the MACD lengths, swing lookback range, and color change thresholds as needed.
Interpret the Signals: Use the color-coded histogram to gauge momentum strength and direction. The swing high/low lines help identify key levels for potential market reversals or entry/exit points.
Practical Applications
Momentum Analysis: Use the color-changing histogram to assess the strength of a trend. Brighter colors indicate stronger momentum, while darker colors suggest weakening trends.
Swing Identification: The swing high and low lines make it easy to identify support and resistance areas where price may reverse.
Entry and Exit Signals: When the histogram color intensity changes, it could be an early indication of a shift in momentum, providing potential buy or sell opportunities.
Customization
This indicator is highly customizable, allowing traders to modify the MACD parameters, swing lookback range, and color change thresholds. This flexibility makes it suitable for different trading styles, whether you're a day trader, swing trader, or long-term investor.
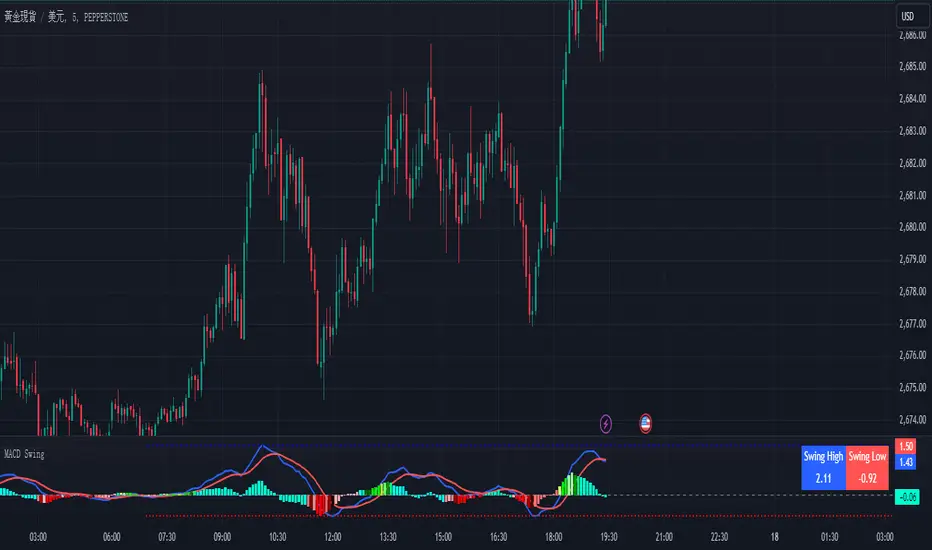
Time and Price Lines and Zones (fadi)
Draw a red line starting from the open at 9:30
Show dotted lines between 11 and 12 and shade it
Mark the ORB high and low from 9:30 to 10:00 and extend it in orange and shade it
In trading, time and price are two crucial elements that help traders make decisions about buying and selling assets like stocks, commodities, or currencies. Forex or futures traders may prefer to trade during the Asia, London, and New York sessions to increase the probability of price moves. Additionally, traders often focus on key levels on the chart to frame their trades.
The Time and Price Lines and Zones indicator allows traders to set an unlimited number of time- and price-based levels on a chart, with full control over how they are displayed. Traders can simply type in their desired settings, and the indicator will interpret the instructions and plot the levels on the chart.
However, as it is a scripted tool, there are some limitations, and traders should keep their inputs relatively straightforward.
How It Works
In the settings, you type in the time and price levels you'd like to see, along with the timeframes for display. Each new line will render a line, a set of lines, or a price zone within a specific time interval. You can specify starting and ending times, price levels such as highs and lows, and details like color, line style, and thickness.
The following are some settings you can use:
Time
Always required, formatted as 0 to 23 for hours (with 0 representing midnight) and 0 to 59 for minutes. You can specify just a start time or both start and end times to "box" a period.
Examples:
1 ( for 1:00 AM)
13 (for 1:00 PM)
13:50 (for 1:50 PM)
Price
Optional. If no price level is provided, the indicator will treat it as an open time window and draw vertical lines at the specified time intervals.
Color
The indicator recognizes the 17 built-in colors from TradingView ( www.tradingview.com ). You also have the option to override or create your own colors to match your color schema under settings. Silver (light gray) is the default if none is specified.
Line Style
There are three available line styles:
Solid (default)
Dashed
Dotted
Line Thickness
Line thickness can also be controlled with the following options:
Thin (default)
Medium
Thick
Fill or No Fill
When specifying two price levels, or two time periods, you can choose to keep the area between them empty or fill it with a semitransparent color. You can set this by specifying "shade," "shaded," "fill," or "filled."
Extend or Not
There are times, such as with the Open Range Breakout (ORB), where you may want to extend the zone without tracking additional price level changes. You can indicate this by specifying whether you want to extend it or not.
Additional Indicator Settings
Ignore lines that start with a defined character to instruct the indicator to ignore the line. For example, if you want to hide a line without deleting it, add # in front of it (default is #).
Hide Above Will hide all lines and zones above a defined timeframe.
Show Next Area Hours in Advance This will plot lines in advance to the right of the current price action, helping traders recognize upcoming points of interest.
Show Last X Days This controls the clutter on the screen by limiting the display to the most recent X number of days.
Fill Transparency The percentage of transparency applied to the background when a fill is specified.
Examples:
12 to 13 gray area shaded with dotted lines
Will result in two vertical lines, one at 12 noon and one at 1 PM, with the area between them shaded gray and a dotted line style.
0:00 vertical line red solid
Adds one vertical red line at midnight.
By specifying the open, high, low, and/or close price components, the indicator will interpret this as an instruction to draw a horizontal line at the specified price level. If two or more price levels are provided, each will be tracked accordingly.
Draw a red line starting from 0 open
Draws a line starting from midnight open until the end of the trading day.
Track high and low starting from 9:30 in a dashed green medium line
Tracks the day’s high and low, adjusting as new highs and lows are drawn in a dashed thicker green line from 9:30 AM until the end of trading hours.
# Asia
20 to 0 green high to low filled
# London
2:00 to 5 blue low and high filled
#New York
8:30 to 11:30 orange zone shaded orange between the high and low dotted
Adds three ICT Kill Zones for Asia, London, and New York based on their respective high and low.
8:30 to 11:30 orange zone shaded orange open close dotted
Will add a second New York zone overlapping the high and low zone.
#Draw Open Range Breakout (ORB)
9:30 to 10:00 purple extended zone
Extends the zone from 9:30 to 10:00 AM with a purple extended zone.

Equal Highs and Lows {Reh's and Rel's }# Equal Highs and Lows {Reh's and Rel's} Indicator
## Overview
The "Equal Highs and Lows {Reh's and Rel's}" indicator is designed to identify and mark equal highs and lows on a price chart. It detects both exact and relative equal levels, draws lines connecting these levels, and optionally labels them. This tool can help traders identify potential support and resistance zones based on historical price levels.
## Key Features
1. **Exact and Relative Equality**: Detects both precise price matches and relative equality within a specified threshold.
2. **Customizable Appearance**: Allows users to adjust colors, line styles, and widths.
3. **Dynamic Line Management**: Automatically extends or removes lines based on ongoing price action.
4. **Labeling System**: Optional labels to identify types of equal levels (e.g., "Equal High", "REH/Equal High").
5. **Flexible Settings**: Adjustable parameters for lookback periods, maximum bars apart, and relative equality thresholds.
## User Inputs
### Appearance
- `lineColorHigh`: Color for lines marking equal highs (default: red)
- `lineColorLow`: Color for lines marking equal lows (default: green)
- `lineWidth`: Thickness of the lines (range: 1-5, default: 1)
- `lineStyle`: Style of the lines (options: Solid, Dash, Dotted)
- `showLabels`: Toggle to show or hide labels for equal highs and lows
### Settings
- `lookbackLength`: Number of bars to look back for finding equal highs and lows (default: 200)
- `maxBarsApart`: Maximum number of bars apart for equal highs/lows to be considered (range: 2-10, default: 5)
### Relative Equality
- `considerRelativeEquals`: Enable detection of relative equal highs and lows
- `thresholdIndex`: Maximum tick difference for relative equality in index instruments (range: 1-10, default: 2)
- `thresholdStocks`: Maximum tick difference for relative equality in stock instruments (range: 5-200, step: 5, default: 10)
## How It Works
The indicator scans historical price data to identify equal or relatively equal highs and lows. It draws lines connecting these levels and updates them as new price data comes in. Lines are extended if the level holds and removed if the price breaks through. The tool adapts to different market conditions by allowing adjustments to the equality thresholds for various instrument types.
## Practical Use
Traders can use this indicator to:
- Identify potential support and resistance levels
- Spot areas where price might react based on historical turning points
- Enhance their understanding of price structure and repetitive patterns
## Disclaimer
This indicator is provided as a tool to assist in identifying potential price levels of interest. It is not financial advice. Users should not rely solely on this or any single indicator for trading decisions. Always conduct thorough analysis, consider multiple factors, and be aware that past price behavior does not guarantee future results. All trading involves risk.

ZigZag ProHello Traders!
TRN ZigZag Pro is an indicator which identifies, and highlights pivot points (swings) and prints useful information about the swings in the chart (e.g. length, duration, ...). The indicator uses an extremely precise swing algorithm to detect the most important pivot points. Compared to other swing or zig-zag indicators TRN ZigZag Pro works in real-time, does not need a look-a-head to find swings and is not repainting. Moreover, equal (double) highs and lows are detected and displayed. The TRN ZigZag Pro helps traders to visualize pure price action and supports the trader to identify key turning points or trends.
The indicator comes with the following features:
Precise real-time swing detection without repainting
Equal/double high and low detection
Displaying of swing labels, values and information
Customizable settings as well as look and feel
It's important to note that the TRN ZigZag Pro is a visual tool and does not provide specific buy or sell signals. It serves as a guide for traders to analyze market structure in depth and make well-informed trading decisions based on their trading strategy and additional technical analysis.
Getting an edge with the TRN ZigZag Pro
The indicator clearly displays up trends, defined as a sequence of higher highs (HH) and higher lows (HL), with green labels and down trends, defined as a sequence of lower lows (LL) and lower highs (LH), with red labels. Equal highs/double tops (DT) and equal lows/ double bottoms (DB) are highlighted in gold.
In addition, the labels show a full stack of valuable information about the swings to maximize your accuracy.
Length
Length percentage in relation to the last swing length
Duration
Label (e.g. HH, LL...)
Use cases for swing detection
Trend Identification
By connecting the swing highs and lows, traders can identify and analyze the prevailing trend in the market. An uptrend is characterized by higher swing highs and lows, while a downtrend is characterized by lower highs and lower lows. The indicator helps traders visually to assess the strength and continuity of the trend.
Support And Resistance Levels
The swing highs and lows can act as support and resistance levels. Swing highs may act as resistance levels where selling pressure increases, while swing lows may act as support levels where buying pressure increases. Traders often pay attention to these levels as potential areas for trade entries, exits, or placing stop-loss orders.
Pattern Recognition
The swings identified by the indicator can help traders recognize chart patterns, such as equal high/lows, consolidations, wedges, triangles or more complex patterns like Gartley or Head and Shoulders. These patterns can provide insights into potential trend continuation or reversal.
Trade Entry and Exit
Traders may use TRN ZigZag Pro to determine potential trade entry and exit points. For example, in an uptrend, traders may look for opportunities to enter long positions near swing lows or on pullbacks to support levels. Conversely, in a downtrend, traders may consider short positions near swing highs or on retracements to resistance levels.
Conclusion
While signals from TRN ZigZag Pro can be informative, it is important to recognize that their reliability may vary. Various external factors can impact market prices, and it is essential to consider your risk tolerance and investment goals when executing trades.
Risk Disclaimer
The content, tools, scripts, articles, and educational resources offered by TRN Trading are intended solely for informational and educational purposes. Remember, past performance does not ensure future outcomes.

Mxwll Price Action Suite [Mxwll]Introducing the Mxwll Price Action Suite!
The Mxwll Price Action Suite is an all-in-one analysis indicator incorporating elements of SMC and also ideas extending beyond the trading methodology!
Features
Internal structures
External structures
Customizable Sensitivities
BoS/CHoCH
Order Blocks
HH/LH/LL/LH Areas
Rolling TF highs/lows
Rolling Volume Comparisons
Auto Fibs
And more!
The image above shows the indicator's market structure identification capabilities. Internal BoS and CHoCH structures in addition to overarching market structures are available with customizable sensitivities.
The image above shows the indicator identifying order blocks! Additionally, HH/LH/LL/LH areas are also identified.
The image above shows a rolling area of interest. These areas can be compared to supply/demand zones, where traders might consider a bargain long/short/sell area.
The indicator displays a rolling 4hr high/low and 1D high/low, alongside auto fibonacci levels with a customizable sensitivity.
Finally, the Mxwll Price Action Suite shows relevant session information.
Table information
Current Session
Countdown to session close
Next Session
Countdown to next session open
Rolling 4-Hr volume intensity
Rolling 24-Hr volume intensity
Introducing the Mxwll SMC Suite!
The Mxwll SMC Suite is an all-in-one analysis indicator incorporating elements of SMC and also ideas extending beyond the trading methodology!
Features
Internal structures
External structures
Customizable Sensitivities
BoS/CHoCH
Order Blocks
HH/LH/LL/LH Areas
Rolling TF highs/lows
Rolling Volume Comparisons
Auto Fibs
And more!
The image above shows the indicator's market structure identification capabilities. Internal BoS and CHoCH structures in addition to overarching market structures are available with customizable sensitivities.
The image above shows the indicator identifying order blocks! Additionally, HH/LH/LL/LH areas are also identified.
The image above shows a rolling area of interest. These areas can be compared to supply/demand zones, where traders might consider a bargain long/short/sell area.
The indicator displays a rolling 4hr high/low and 1D high/low, alongside auto fibonacci levels with a customizable sensitivity.
Finally, the Mxwll Price Action Suite shows relevant session information.
Table information
Current Session
Countdown to session close
Next Session
Countdown to next session open
Rolling 4-Hr volume intensity
Rolling 24-Hr volume intensity
Expanded Features of Mxwll Price Action Suite
Internal and External Structures
Internal Structures: These elements refer to the price formations and patterns that occur within a smaller scope or a specific trading session. The suite can detect intricate details like minor support/resistance levels or short-term trend reversals.
External Structures: These involve larger, more significant market patterns and trends spanning multiple sessions or time frames. This capability helps traders understand overarching market directions.
Customizable Sensitivities
Adjusting sensitivity settings allows users to tailor the indicator's responsiveness to market changes. Higher sensitivity can catch smaller fluctuations, while lower sensitivity might focus on more significant, reliable market moves.
Break of Structure (BoS) and Change of Character (CHoCH)
BoS: This feature identifies points where the price breaks a significant structure, potentially indicating a new trend or a trend reversal.
CHoCH: Detects subtle shifts in the market's behavior, which could suggest the early stages of a trend change before they become apparent to the broader market.
Order Blocks and Market Phases
Order Blocks: These are essentially price levels or zones where significant trading activities previously occurred, likely pointing to the positions of smart money.
HH/LH/LL/LH Areas: Identifying Higher Highs (HH), Lower Highs (LH), Lower Lows (LL), and Lower Highs (LH) helps in understanding the trend and market structure, aiding in predictive analysis.
Rolling Timeframe Highs/Lows and Volume Comparisons
Tracks highs and lows over specified rolling periods, providing dynamic support and resistance levels.
Compares volume data across different timeframes to assess the strength or weakness of the current price movements.
Auto Fibonacci Levels
Automatically calculates and plots Fibonacci retracement levels, a popular tool among traders to identify potential reversal points based on past movements.
Session Data and Volume Intensity
Session Information: Displays current and upcoming trading sessions along with countdown timers, which is crucial for day traders and those trading on session overlaps.
Volume Intensity: Measures and compares the volume within the last 4 hours and 24 hours to gauge market activity and potential breakout/breakdown movements.
Visualizations and Practical Use
Dynamic Visuals: The suite provides dynamic visual aids, such as real-time updating of high/low markers and Fibonacci levels, which adjust as new data comes in. This feature is critical in fast-paced markets.
Strategic Entry/Exit Points: By identifying order blocks and using Fibonacci levels, traders can pinpoint strategic entry and exit points, maximizing potential returns.
Risk Management: Enhanced features like session countdowns and volume intensity help in better risk management by providing traders with more data on market sentiment and potential volatility.

Fib Pivot Points HLThis TradingView indicator allows users to select a specific timeframe (TF) and then analyzes the high, low, and closing prices from the past period within that TF to calculate a central pivot point. The pivot point is determined using the formula (High + Close + Low) / 3, providing a key level around which the market is expected to pivot or change direction.
In addition to the central pivot point, the indicator enhances its utility by incorporating Fibonacci levels. These levels are calculated based on the range from the low to the high of the selected timeframe. For instance, a Fibonacci level like R0.38 would be calculated by adding 38% of the high-low range to the pivot point, giving traders potential resistance levels above the pivot.
Key features of this indicator include:
Timeframe Selection: Users can choose their desired timeframe, such as weekly, daily, etc., for analysis.
Pivot Point Calculation: The indicator calculates the pivot point based on the previous period's high, low, and closing prices within the selected timeframe.
Fibonacci Levels: Adds Fibonacci retracement levels to the pivot point, offering traders additional layers of potential support and resistance based on the natural Fibonacci sequence.
This indicator is particularly useful for traders looking to identify potential turning points in the market and key levels of support and resistance based on historical price action and the Fibonacci sequence, which is widely regarded for its ability to predict market movements.
Example:
Suppose you're analyzing the EUR/USD currency pair using this indicator with a weekly timeframe setting. The previous week's price action showed a high of 1.2100, a low of 1.1900, and the week closed at 1.2000.
Using the formula ( High + Close + Low ) / 3 (High+Close+Low)/3, the pivot point would be calculated as ( 1.2100 + 1.2000 + 1.1900 ) / 3 = 1.2000. Thus, the central pivot point for the current week is at 1.2000.
The range from the low to the high is 1.2100 − 1.1900 = 0.0200 1.2100−1.1900=0.0200.
To calculate a specific Fibonacci level, such as R0.38, you would add 38% of the high-low range to the pivot point: 1.2000 + ( 0.0200 ∗ 0.38 ) = 1.2076 1.2000+(0.0200∗0.38)=1.2076. Thus, the R0.38 Fibonacci resistance level is at 1.2076.
Similarly, you can calculate other Fibonacci levels such as S0.38 (Support level at 38% retracement) by subtracting 38% of the high-low range from the pivot point.
Traders can use the pivot point as a reference for the market's directional bias: prices above the pivot point suggest bullish sentiment, while prices below indicate bearish sentiment. The Fibonacci levels act as potential stepping stones for price movements, offering strategic points for entry, exit, or placing stop-loss orders.
